Workplace Safety Statistics Infographic: Safety at Work
Workplace safety is not something that can’t be achieved, and it’s something that should be constantly improved so our workers return home safely at the end of each workday. Workplace safety starts by knowing just how important it is, which is broken down in the workplace safety statistics in this infographic. It states that:
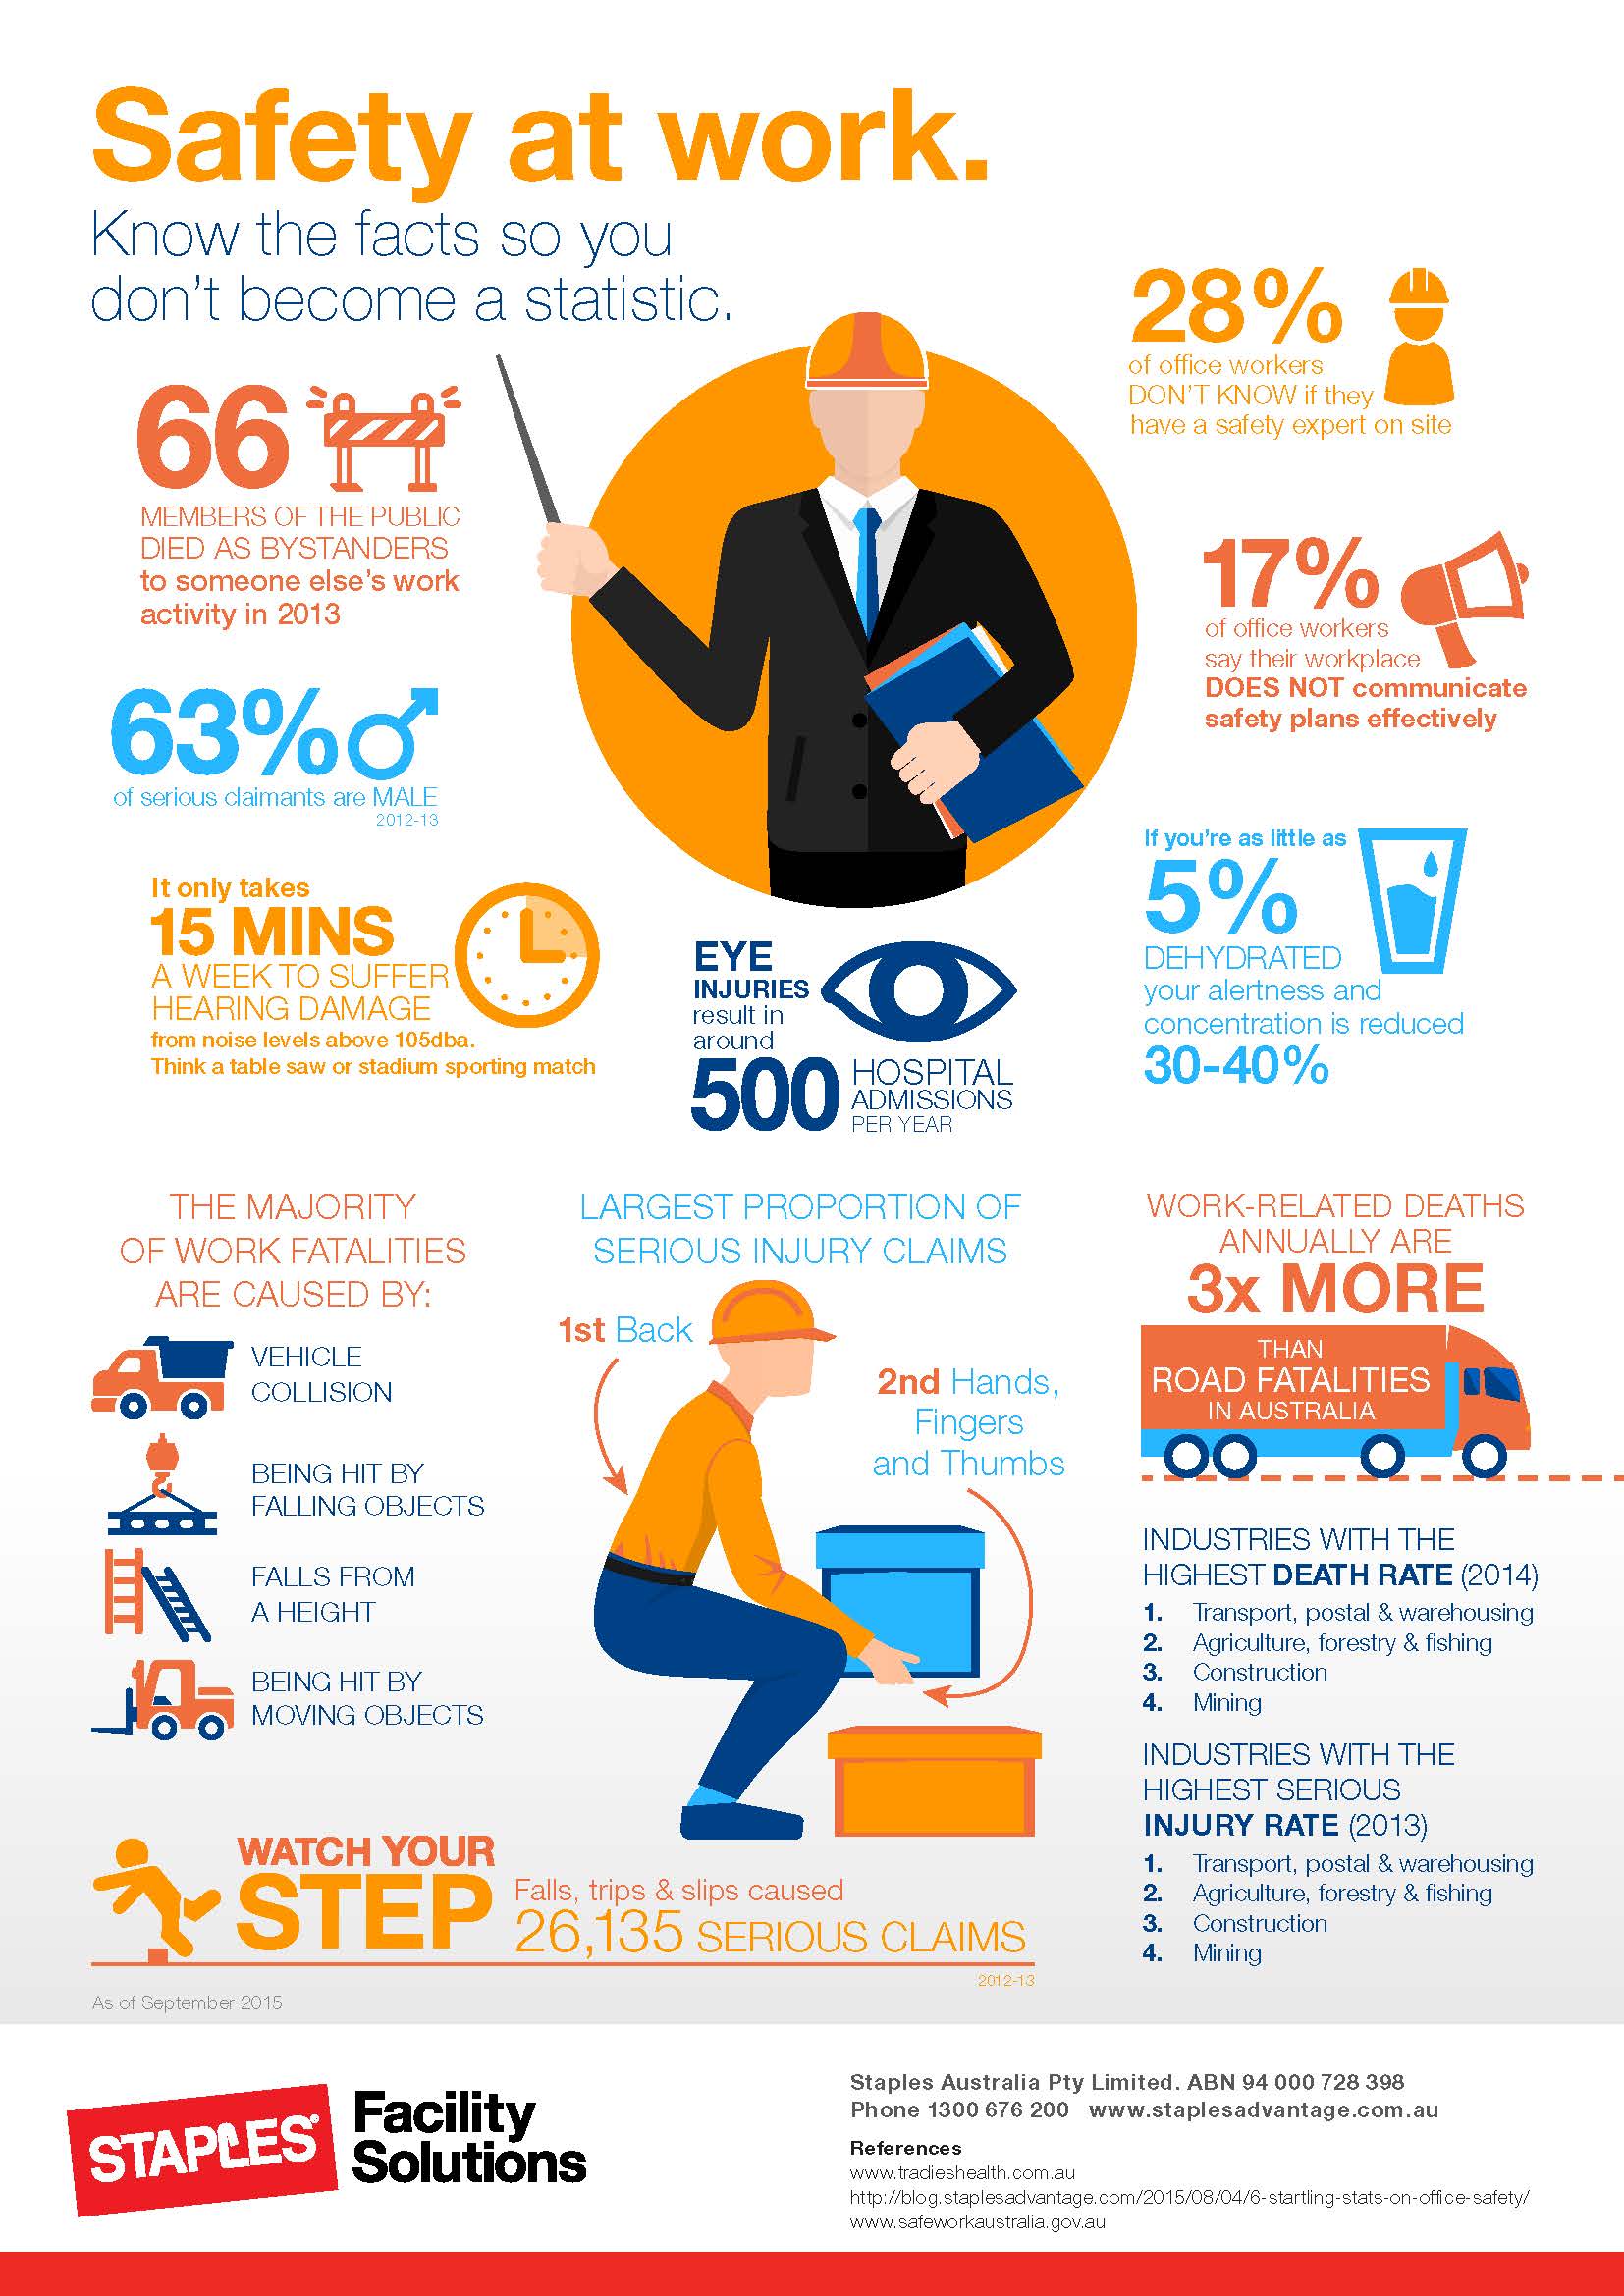
66 members of the public died as a bystander to someone else’s work activity in 2013
28% of office workers don’t know if they have a safety expert on site
17% of office workers say their workplace does not communicate safety plans effectively
63% of serious claimants are male
17% of office workers say their workplace does not effectively communicate safety plans
63% of serious claimants are male
It only takes 15 minutes a week to suffer from hearing damage from noise levels above 105dba
Eye injuries result in about 500 hospital admissions a year
If you’re as little as 5% dehydrated, your mental alertness and concentration can decrease by 30-40%
The majority of workplace injuries are caused by:
Vehicle collisions
Being hit by falling objects
Falls from heights
Being hit by moving objects
Largest proportion of serious injuries claims come from back injuries and hand and finger injuries.
Work-related deaths are 3x more likely than vehicle accidents in Australia
Industries with the highest death rate (2014) are:
Transport, postal and warehousing
Agriculture, forestry, fishing
Construction
Mining
Industries with the highest injury rate (2014):
Transport, postal and warehousing
Agriculture, forestry, fishing
Construction
Mining
Share this infographic on your favorite social media outlet!
Twitter
Facebook
Linked in
Or, embed this on your site! (Just copy and paste the code, we do ask that you include a short intro that links to us)
Related Category: Workplace Safety Training
Source: Staples Facility Solutions
The Atlantic Research Team is our in-house editorial staff. Content published under this name is a collaborative effort, written and reviewed by multiple safety and HR specialists to ensure all information is accurate, practical, and up to date.